Java Garbage Collection (GC) In-Depth Analysis

Java Garbage Collection (GC) In-Depth Analysis

Java’s Garbage Collection (GC) is the core mechanism of automated memory management. It avoids the complexity and risks of manual memory management by automatically reclaiming memory occupied by unused objects. Below is an in-depth analysis covering principles, algorithms, collectors, tuning, and more:

I. Basic Concepts of Garbage Collection

1. Reachability Analysis

  • GC Roots: A collection of root objects, including:
  • Objects referenced by the local variable table in stack frames (virtual machine stack)
  • Objects referenced by static attributes in the method area
  • Objects referenced by constants in the method area
  • Objects referenced by JNI (Native methods) in the native method stack
  • Unreachable Objects: Objects that cannot be traced through GC Roots are marked as garbage.

2. Generational Collection Theory

  • Weak Generational Hypothesis: Most objects have short lifespans (e.g., method local variables).
  • Strong Generational Hypothesis: Objects that survive multiple garbage collections are more likely to live longer (e.g., static objects).
  • Intergenerational Reference Hypothesis: Intergenerational references are far fewer than intragenerational references, which can be optimized using a Remembered Set.

II. Garbage Collection Algorithms

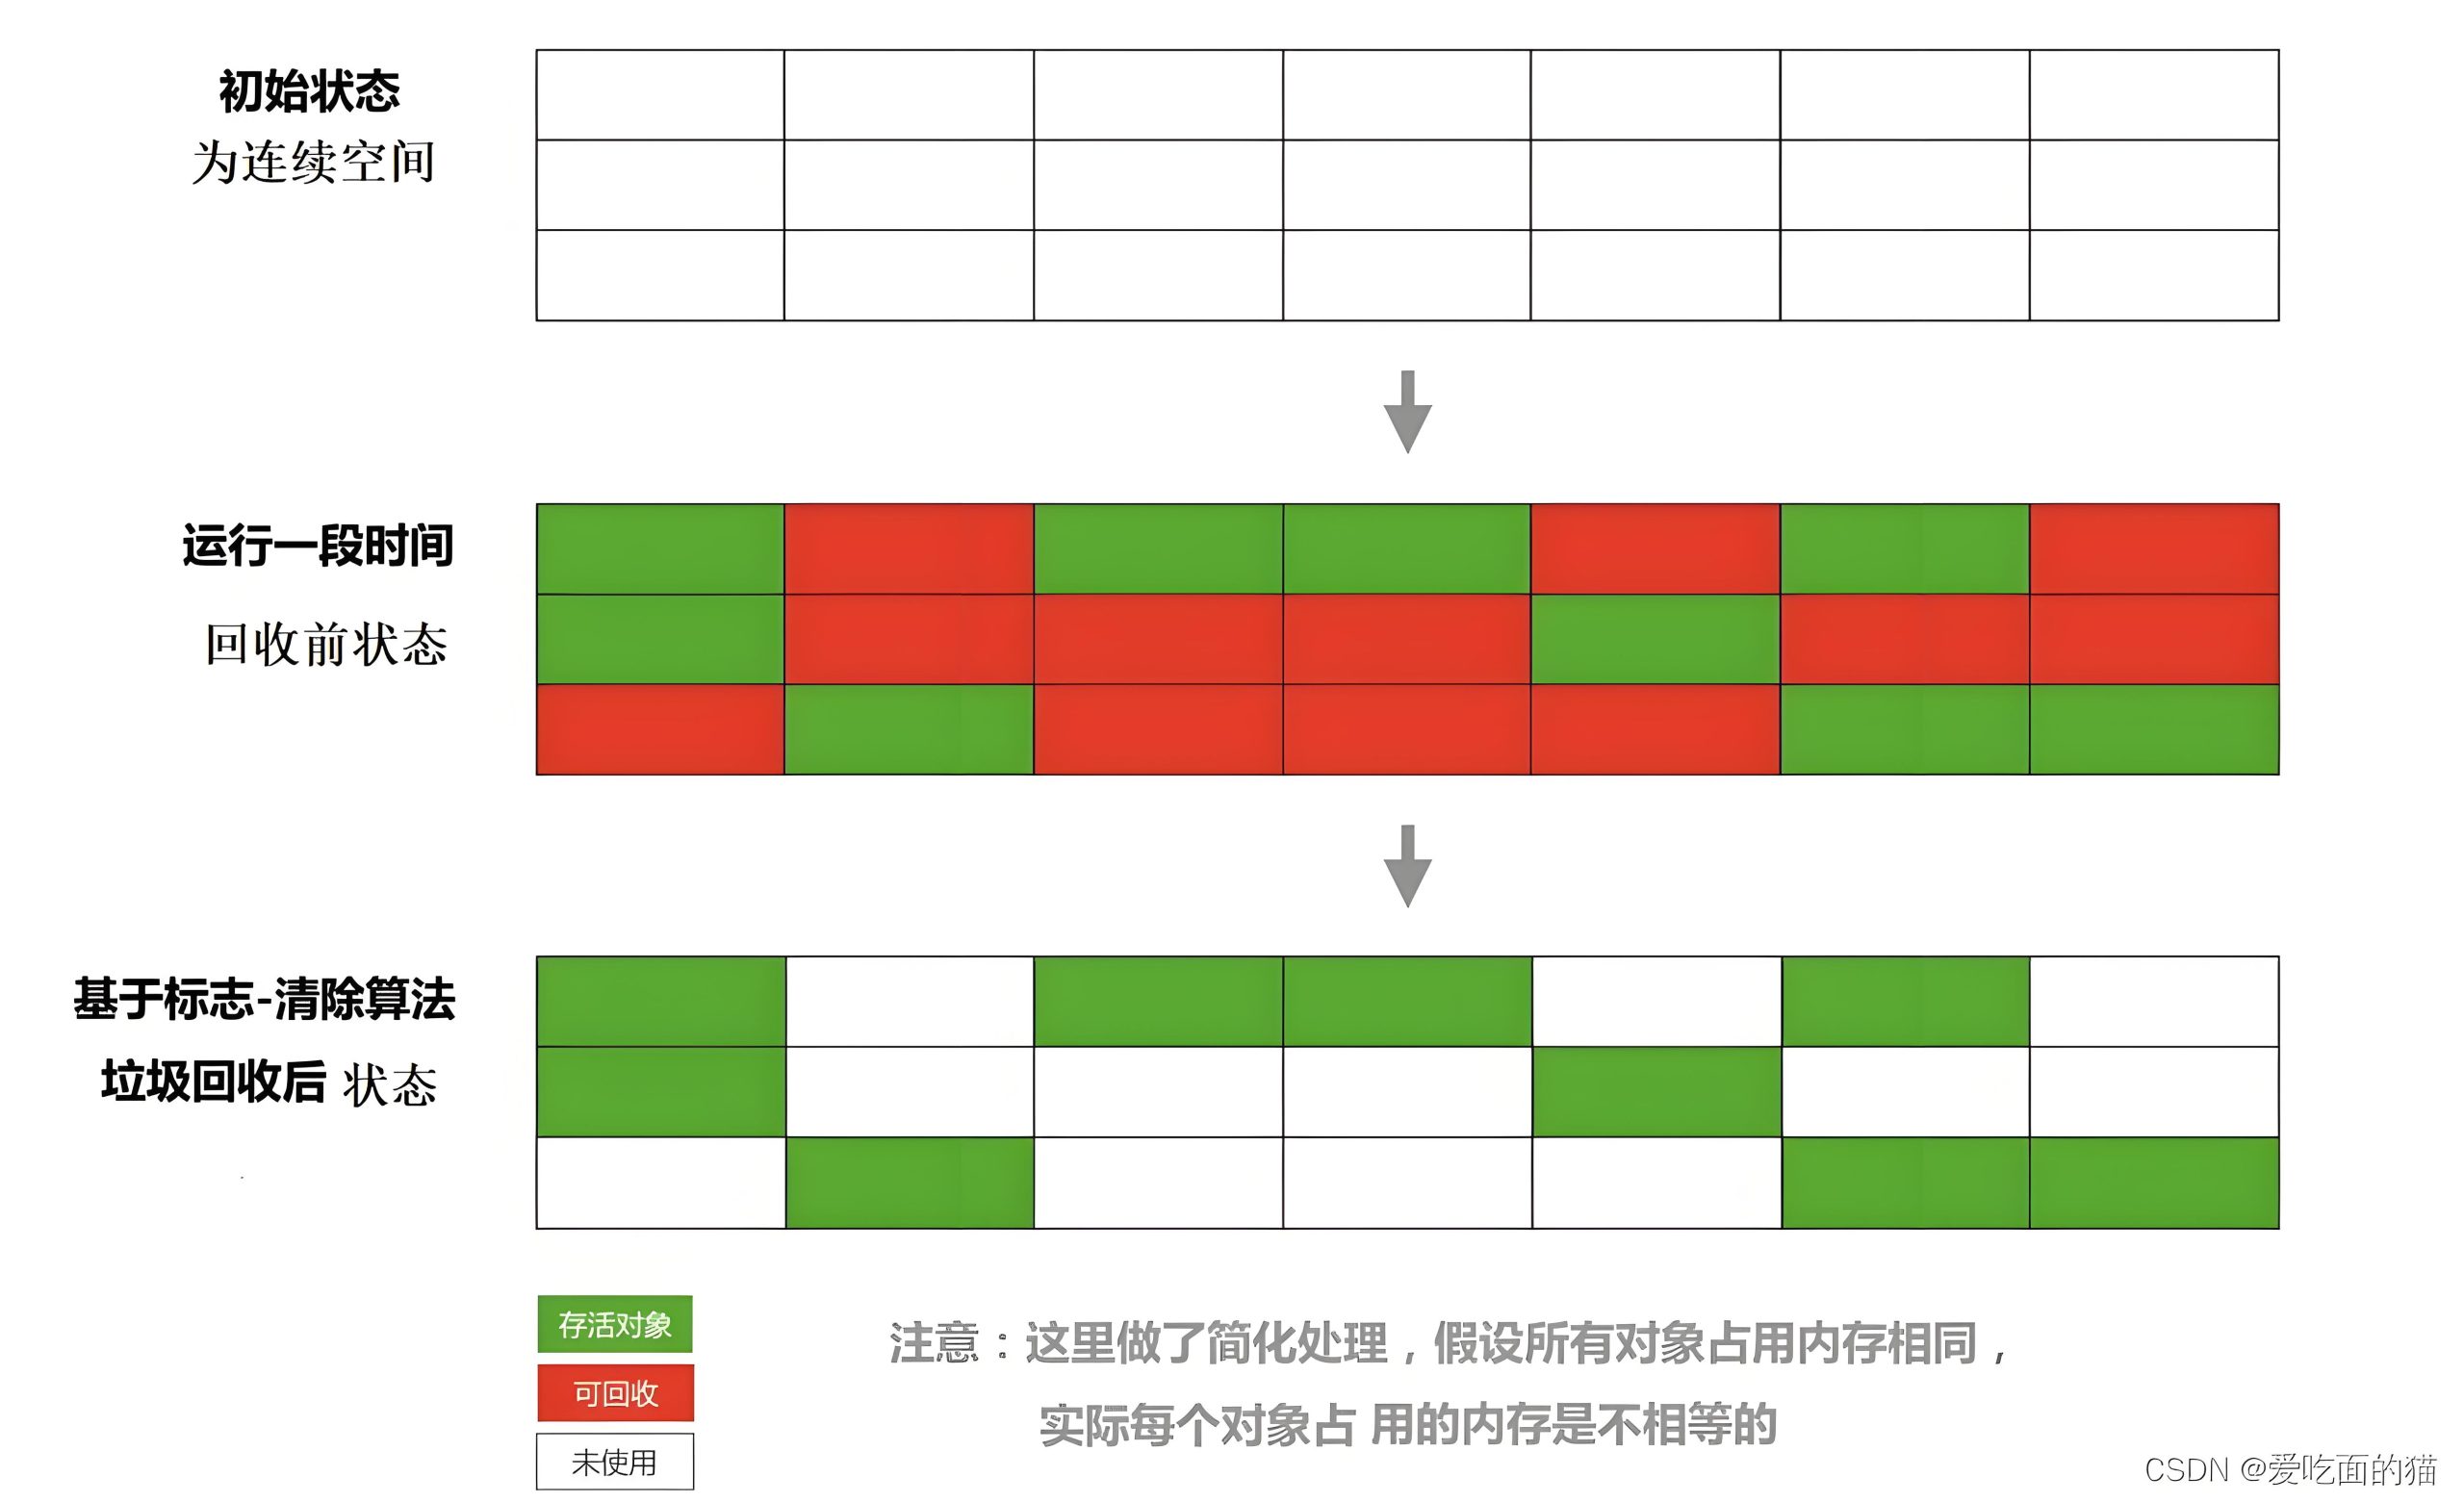
1. Mark-Sweep Algorithm

  • Process: Mark surviving objects → Clear unmarked objects.
  • Disadvantage: Generates memory fragmentation, which may prevent large objects from being allocated.

2. Mark-Compact Algorithm

  • Process: Mark surviving objects → Move surviving objects to one end → Clean up memory beyond the boundary.
  • Advantage: Solves the problem of memory fragmentation.
  • Applicable Scenario: Old generation (where objects have high survival rates).

3. Copying Algorithm

  • Process: Divide memory into two blocks, using only one block at a time → During GC, copy surviving objects to the other block → Clear the original area.
  • Advantage: High efficiency, no memory fragmentation.
  • Disadvantage: Low memory utilization (half the space needs to be reserved).
  • Applicable Scenario: Young generation (where objects have low survival rates). Modern JVMs default to an Eden:Survivor ratio of 8:1:1.

4. Generational Collection Algorithm

  • Young Generation: Uses the Copying algorithm (Minor GC is frequent but efficient).
  • Old Generation: Uses Mark-Sweep or Mark-Compact (Major GC/Full GC is less frequent).

III. Garbage Collectors

1. Young Generation Collectors

CollectorAlgorithmCharacteristicsApplicable Scenarios
SerialCopyingSingle-threaded, stops user threadsSingle-CPU environments, small-memory applications
ParNewCopyingMulti-threaded parallelServer mode with CMS
Parallel ScavengeCopyingThroughput priorityBackground computing, throughput-sensitive applications

2. Old Generation Collectors

CollectorAlgorithmCharacteristicsApplicable Scenarios
Serial OldMark-CompactSingle-threadedClient mode or with Serial collector
Parallel OldMark-CompactMulti-threaded parallelWith Parallel Scavenge
CMS (Concurrent Mark Sweep)Mark-SweepLow pause, concurrent collectionWeb servers, response-sensitive systems
G1 (Garbage-First)Mark-CompactPartitioned, predictable pause timesLarge-memory, multi-CPU servers

3. ZGC and Shenandoah

  • Characteristics: Ultra-low latency (sub-millisecond), using technologies such as read barriers and colored pointers.
  • Applicable Scenarios: Systems extremely sensitive to latency (e.g., financial transactions, real-time games).

IV. GC Trigger Conditions

1. Young Generation GC (Minor GC)

  • Trigger Condition: Triggered when the Eden area is full.
  • Characteristics: Fast, frequently triggered, may involve objects being promoted to the old generation.

2. Old Generation GC (Major GC/Full GC)

  • Trigger Conditions:
  • Insufficient space in the old generation (e.g., the size of the promoted object exceeds the remaining space).
  • CMS concurrent failure (Concurrent Mode Failure).
  • Explicit call to System.gc() (recommended to avoid).
  • Characteristics: Long pause time, requiring careful optimization.

V. GC Log Analysis

1. Enabling GC Logs

java -XX:+PrintGCDetails -XX:+PrintGCTimeStamps -Xloggc:/path/to/gc.log YourMainClass

2. Typical Log Examples

[GC (Allocation Failure) [PSYoungGen: 8192K->512K(9216K)] 8192K->6848K(19456K), 0.0034949 secs][Full GC (Metadata GC Threshold) [PSYoungGen: 512K->0K(9216K)] [ParOldGen: 6336K->6848K(10240K)] 6848K->6848K(19456K), [Metaspace: 2560K->2560K(1056768K)], 0.0254310 secs]

3. Key Indicators

  • GC Type: GC (Minor GC) or Full GC.
  • Memory Change: e.g., 8192K->512K(9216K) indicates before GC → after GC → total space.
  • Pause Time: e.g., 0.0034949 secs.

VI. JVM Parameter Tuning

1. Heap Memory Allocation

# Initial and maximum heap memory are both 2GB, young generation accounts for 1GBjava -Xms2g -Xmx2g -Xmn1g YourMainClass

2. Collector Selection

# Use G1 collector with a target maximum pause time of 200msjava -XX:+UseG1GC -XX:MaxGCPauseMillis=200 YourMainClass

3. Tuning Example

# Recommended configuration for high-concurrency Web applicationsjava -Xms4g -Xmx4g \     -XX:SurvivorRatio=8 \     -XX:+UseConcMarkSweepGC \     -XX:+CMSParallelRemarkEnabled \     -XX:+CMSScavengeBeforeRemark \     -XX:+HeapDumpOnOutOfMemoryError \     -jar your-app.jar

VII. Common Issues and Solutions

1. Frequent Full GC

  • Causes: Insufficient old generation space, large objects directly entering the old generation.
  • Solutions:
  • Increase heap memory or adjust the ratio between young and old generations.
  • Avoid creating overly large objects (e.g., oversized arrays).
  • Check for memory leaks (e.g., static collections holding object references).

2. Long GC Pauses

  • Causes: Using CMS or Parallel collectors, which cause STW (Stop The World) during Full GC.
  • Solutions:
  • Switch to G1 or ZGC collectors.
  • Increase -XX:ParallelGCThreads to improve the number of GC threads.

3. OutOfMemoryError (OOM)

  • Causes: The rate of object creation exceeds the GC recycling rate.
  • Solutions:
  • Optimize code to reduce object lifecycle.
  • Increase heap memory size.
  • Use memory analysis tools (e.g., MAT) to locate memory leak points.

VIII. Garbage Collector Comparison

CollectorPause TimeThroughputApplicable Scenarios
SerialLongLowSingle-CPU, small-memory applications
ParallelRelatively longHighBackground computing, throughput priority
CMSShortMediumWeb servers, response-sensitive systems
G1ShortHighLarge-memory, multi-CPU servers
ZGCExtremely shortMediumUltra-low latency, large-memory scenarios

IX. GC Monitoring Tools

Command-Line Tools

jstat -gc <pid> 1000 10  # Output GC statistics once per second, 10 times in totaljmap -histo <pid>        # View object distributionjmap -dump:format=b,file=heapdump.hprof <pid>  # Generate heap dump file

Visualization Tools

  • VisualVM: Real-time monitoring of memory, threads, and GC status.
  • MAT (Memory Analyzer Tool): Analyze heap dump files to locate memory leaks.
  • GCEasy: Online GC log analysis tool that generates detailed reports.

X. Future Trends

  • Epsilon: An experimental no-GC collector for performance testing.
  • Shenandoah: Similar to G1 but with shorter pause times.
  • GraalVM: Ahead-of-time (AOT) compilation reduces runtime GC pressure.

Understanding the GC mechanism is key to Java performance tuning. It is necessary to select appropriate collectors and parameter configurations based on application characteristics (e.g., memory size, response time requirements) and continuously optimize using monitoring tools.

Comments

No comments yet. Why don’t you start the discussion?

Leave a Reply

Your email address will not be published. Required fields are marked *